Pathways Editor
Overview
In the context of LCA within PyGREET, Pathways represent the sequential structure of operations required to convert feedstocks into final products. This organizational unit allows users to model complex manufacturing chains, such as the production of ethanol from various sorghum varieties.
Core Structure and Connectivity
A pathway is fundamentally a directed graph, which can include cyclic dependencies to represent intricate sub-processes. This flexibility is essential for modeling detailed industrial environments. For example, a refinery pathway might encompass several internal activities and outputs:
- Internal Activities: Distillation, Hydrocracking, Alkylation, and Polymerization.
- Resulting Outputs: Gasoline, solvents, jet fuel, and residual oil.
Modular Reusability
One of the most powerful features of PyGREET is the ability to repurpose pathways as feedstocks for other pathways. This modular approach saves significant time by allowing the reuse of existing entities rather than rebuilding them from scratch.
- Example: The "Corn Production" pathway serves as a direct precursor (input) for the "Ethanol Production from Corn" pathway.
- Implementation: In the editor, users can simply drag and drop an existing pathway into the workspace.
- Visual Distinction: Unlike individual processes, a nested pathway does not visually display its internal inputs. Only the final outputs of the nested pathway are available to be linked to subsequent process inputs.
The Pathways Editor in PyGREET is a visual tool for constructing, modifying, and analyzing life cycle pathways. These pathways serve as one of the final outputs of PyGREET, having results generated for analysis for the entire life cycle process.
The Pathway Editor
The Pathways Editor serves as the primary visual interface in PyGREET for constructing, modifying, and analyzing life cycle chains. Utilizing a canvas-based layout similar to a transportation step, it allows users to build pathways consisting of nodes connected by edges. These nodes typically follow a hierarchical structure of Pathways, Mixes, Stationay Processes, and Transportation Processes designed to generate a final Product. To build a model, users simply select an entity from the library and perform a drag-and-drop action onto the workspace. Because these pathways consolidate every operation and event in a production sequence, they function as the ultimate level of analysis, providing the final results for the entire life cycle.
There are four bottom tabs in the Pathway Editor:
- General Information Tab: Displays the name and notes of the pathway
- Pathway Editor Tab: Main tab for modifying a pathway
- Results Tab: View and analyze pathway results
- Usage Tab
The functionality of the usage tab is explained within the relevant section within the Tab Navigation Section.
Node Colors
Nodes are color coded:
- Yellow: Transportation Processes
- Light Blue: Stationary Processes
- Green: Pathways
- Dark Blue: Pathway Mixes
- Red: Vehicles
Vehicle Limitation
If a vehicle is added, it must be the final Product of the pathway, and cannot be used as an intermediate step. Additionally, no other outputs may be present in the pathway. The vehicle block serves as the main output.
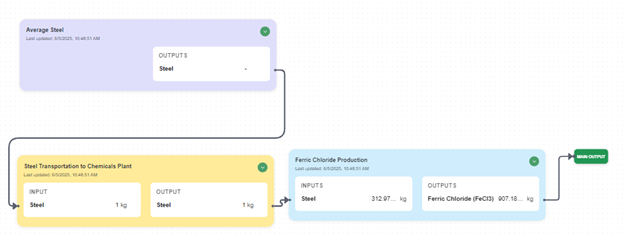
Building Blocks
Stationary and Transportation Processes are used as the main building blocks of a pathway:
- Most Stationary Processes, and all Transportation Processes, take in some input to provide some output
- A separate Stationary Process, or a pathway or pathway mix, must serve as the source for any relevant inputs
Note
Inputs that do not come from a previous source (e.g., inputs in a stationary process that are primary resources or have their source defined in the SPE) do not appear, as they do not need to be connected. All shown inputs must have a source provided.
Outputs
Transportation and Stationary Processes have one or more outputs. These outputs can:
- Connect to other nodes
- Be dragged onto the canvas to produce an "Output" block
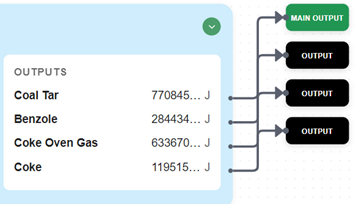
Output Blocks
Output blocks serve as the final products of a pathway, if a vehicle is not present
- Can have more than one output block
- Must have exactly one Main Output: The designated central output of the pathway
Making a Main Output: Right-click an output and select "Make Main Output."
Vehicle Blocks
Vehicle blocks have one or more inputs, similar to Stationary and Transportation Process Blocks. However, they have no output. A pathway can only have one vehicle block, which serves as the main, and only, output of the pathway. No other output blocks may be present.
Results Section
The results section serves to define the results of a Pathway. This view is the same for Non-Vehicle Pathways and Pathway Mixes, and shows the final LCA results.
Important
For Results for Pathways containing a Vehicle Blocik, please see the results section in the Vehicle Editor
Four Main Results Views
- Table view (initial)
- Well-to-Use metric contribution graph
- Direct and Upstream metric Contribution graph
- Well-to-Use relative metric contribution graph
- Graphical Breakdown of Results by Process
Choose using the five buttons to the left of the exit results button at the top.
Results Controls
For all results views, you can set:
- Output
- Functional unit of the output
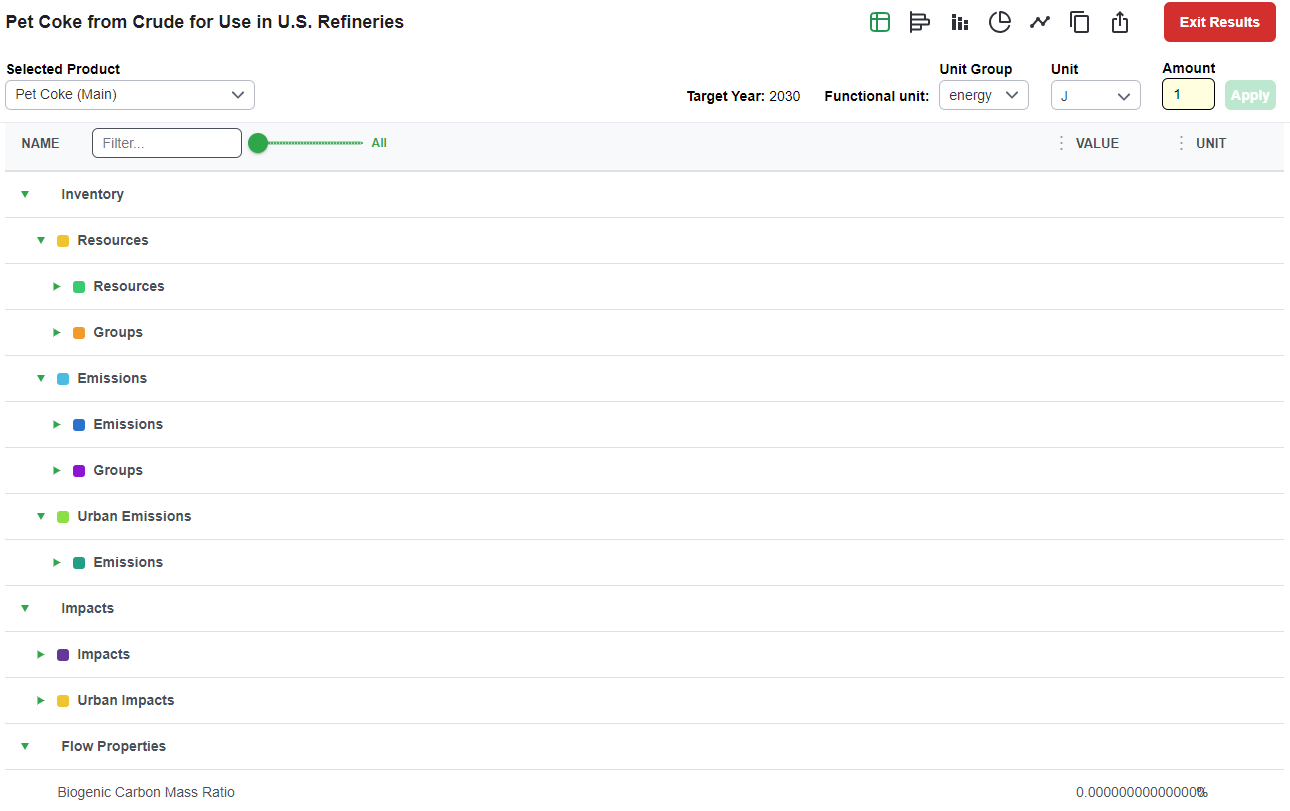
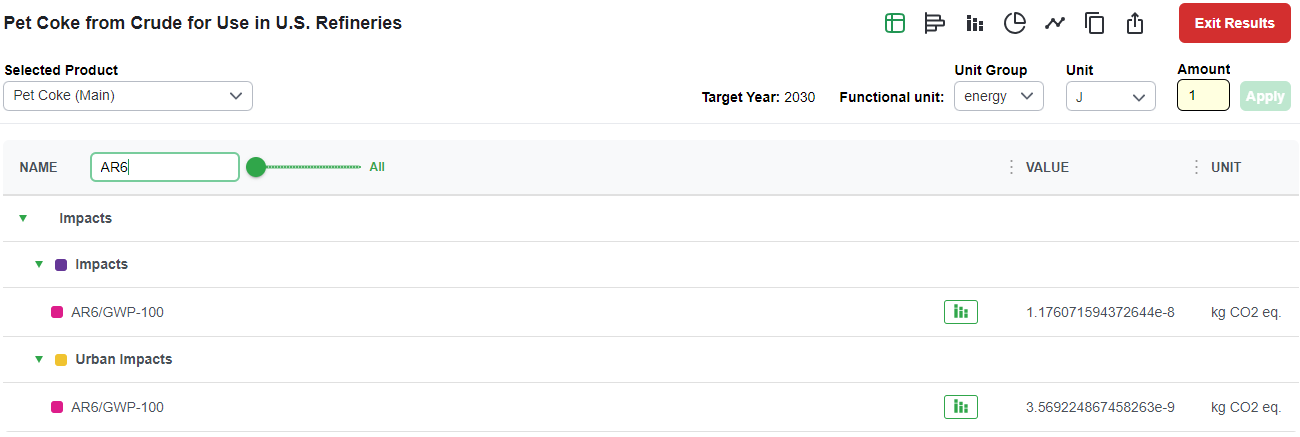
Table View
In the initial results view, the results are tabular to show both the life cycle inventory and impacts.
- Each section can be clicked on to expand the dropdown, showing the nested results
- Search bar: Filter the table based on a desired metric name (e.g., Total Energy)
- Metric value slider: Filter the table based on a minimum value for metric, e.g., showing metrics >= 1e-5
- Graph button: Every Impact or Inventory item has a graph button to display the Well-to-Use metric contribution for that item
- Copy Results: This feature allows you to copy the entire results table, or the filtered results if a filter has been applied. Additionally, you can hover over a specific result, as shown in the figure below, and click the clipboard copy icon on the right side of the row
- Export to Excel: This feature allows you to export the complete pathway results, including the direct and upstream metrics for each individual pathway element
Metric Contribution Graphs
When loading any one of the three metric contribution graphs:
- First choose a selected metric (if not chosen from the table view by clicking the button)
- A graph will show the breakdown of the selected metric
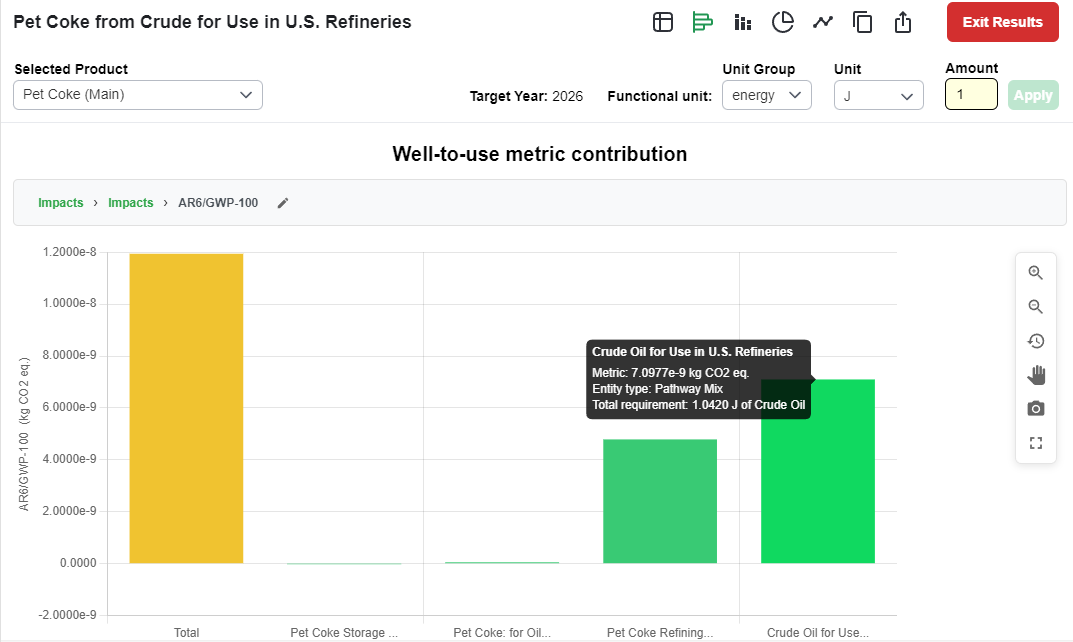
Well-to-Use Metric Contribution Graph
Shows the breakdown by process for the pathway using a well-to-use system boundary.
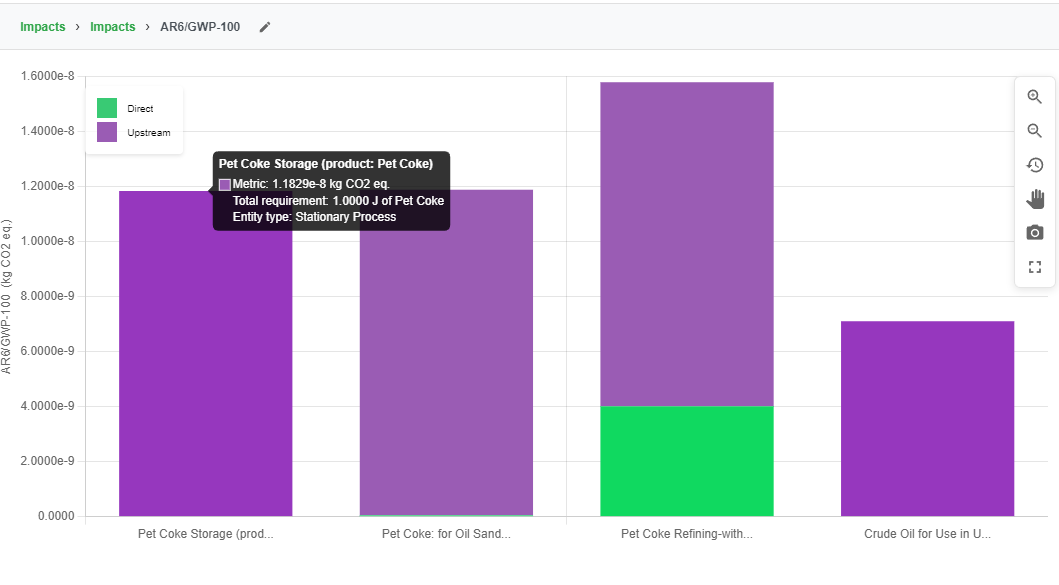
Direct and Upstream Metric Contribution Graph
Shows a similar graph, breaking down the emissions by direct or upstream contribution.
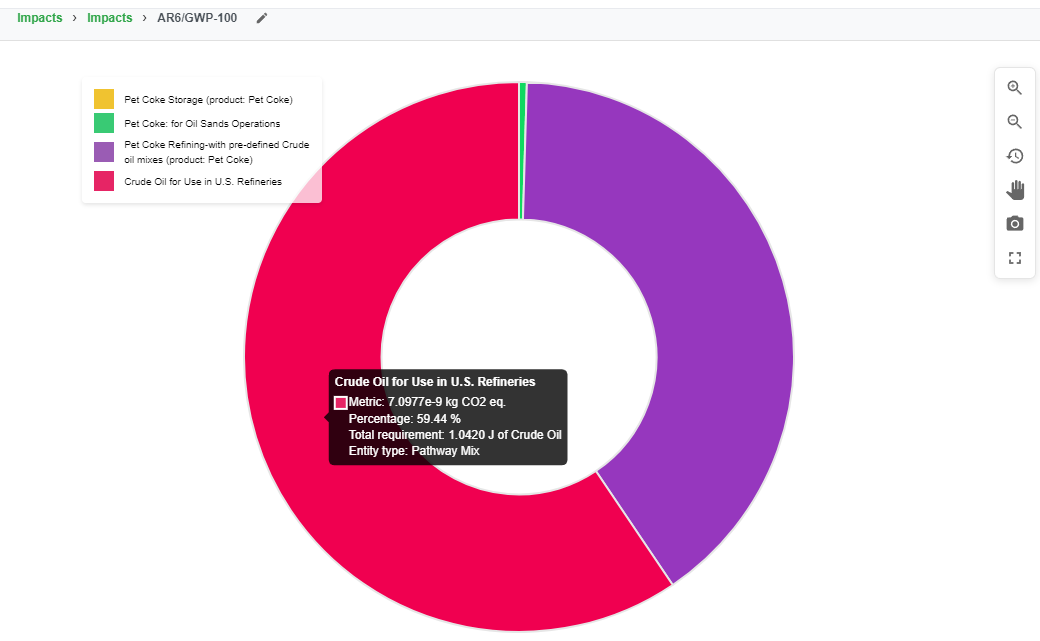
Well-to-Use Relative Contribution
Shows the breakdown of processes as a relative percentage of the total impacts for a well to use system boundary.
Switching Metrics in a Plot
Inside any contribution graph, click the pencil icon next to the metric name at the top of the plot to swap to a different metric.
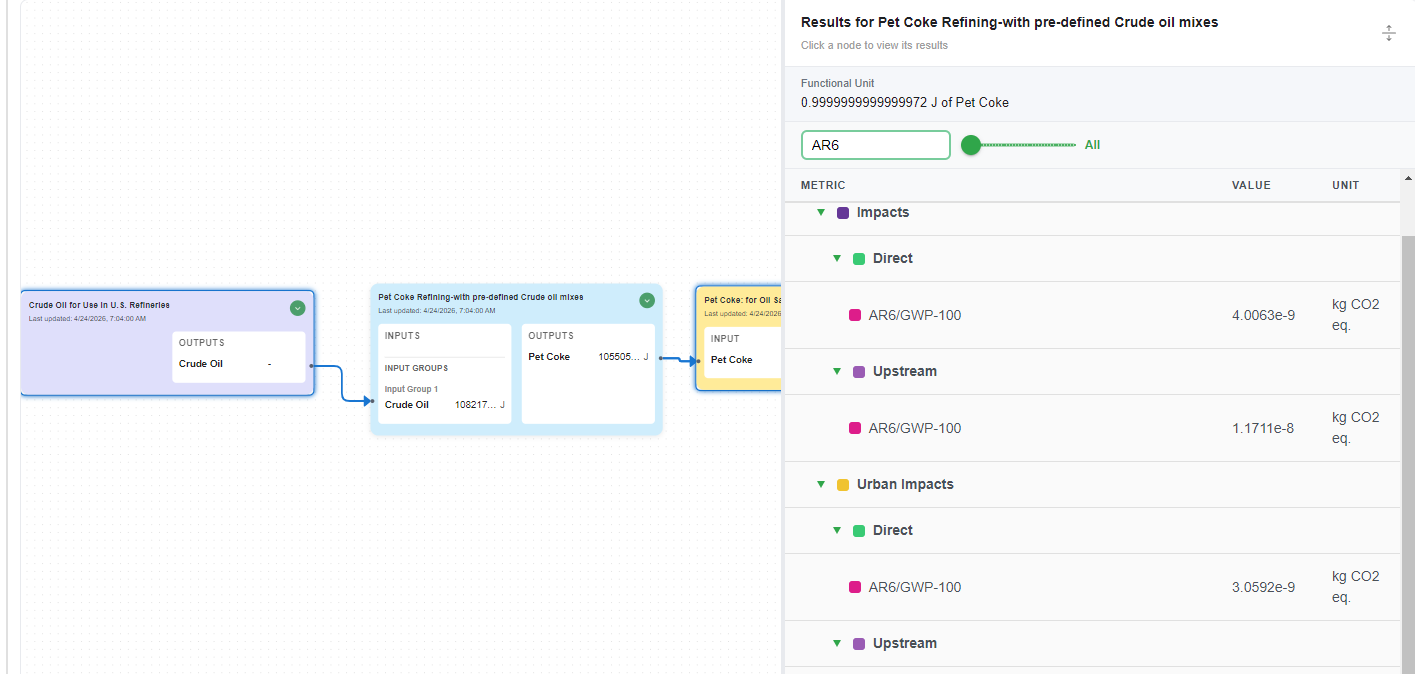
Graphical Breakdown of Results by Process
The Graphical Breakdown view will show the pathway on the canvas, in the same layout as in the Editor Tab. A table to the right of the canvas will show the results initially for the entire pathway, in the same format as the Table View.
Clicking on a node within the canvas will display the results for that process, including direct and upstream results. Unlike the Pathway Editor tab, nodes cannot be moved or deleted, as this view is just to view results, not to edit the pathway.
Results are displayed per functional unit, located at the top of the table. Additionally, the results can be filtered, similar to the Table View.